Dashboards Built in Minutes, Not Weeks
Describe what you want to track and Basedash generates a complete dashboard. Drag, drop, and customize — or let AI handle the layout. Unlimited dashboards and charts on every plan.
Key Capabilities
Prompt-to-Dashboard
Describe what you want to see — 'Create a dashboard showing revenue by practice group, utilization trends, and collections aging' — and Basedash builds it in minutes with the right chart types and layouts.
Drag-and-Drop Customization
Resize, reorder, and refine any chart after generation. Add new visualizations by asking for them in natural language, or fine-tune SQL for advanced users.
Scheduled Reports
Set dashboards to auto-deliver via email or Slack on your schedule. Describe what you want in the report — executive summary, weekly KPI digest, monthly trend analysis — and Basedash generates and delivers it automatically.
Unlimited Dashboards & Charts
Create as many dashboards and charts as you need — no per-dashboard pricing. Line charts, bar charts, KPI cards, retention views, cohort analysis, and more.
Use Cases by Industry
See how this feature applies to your industry.
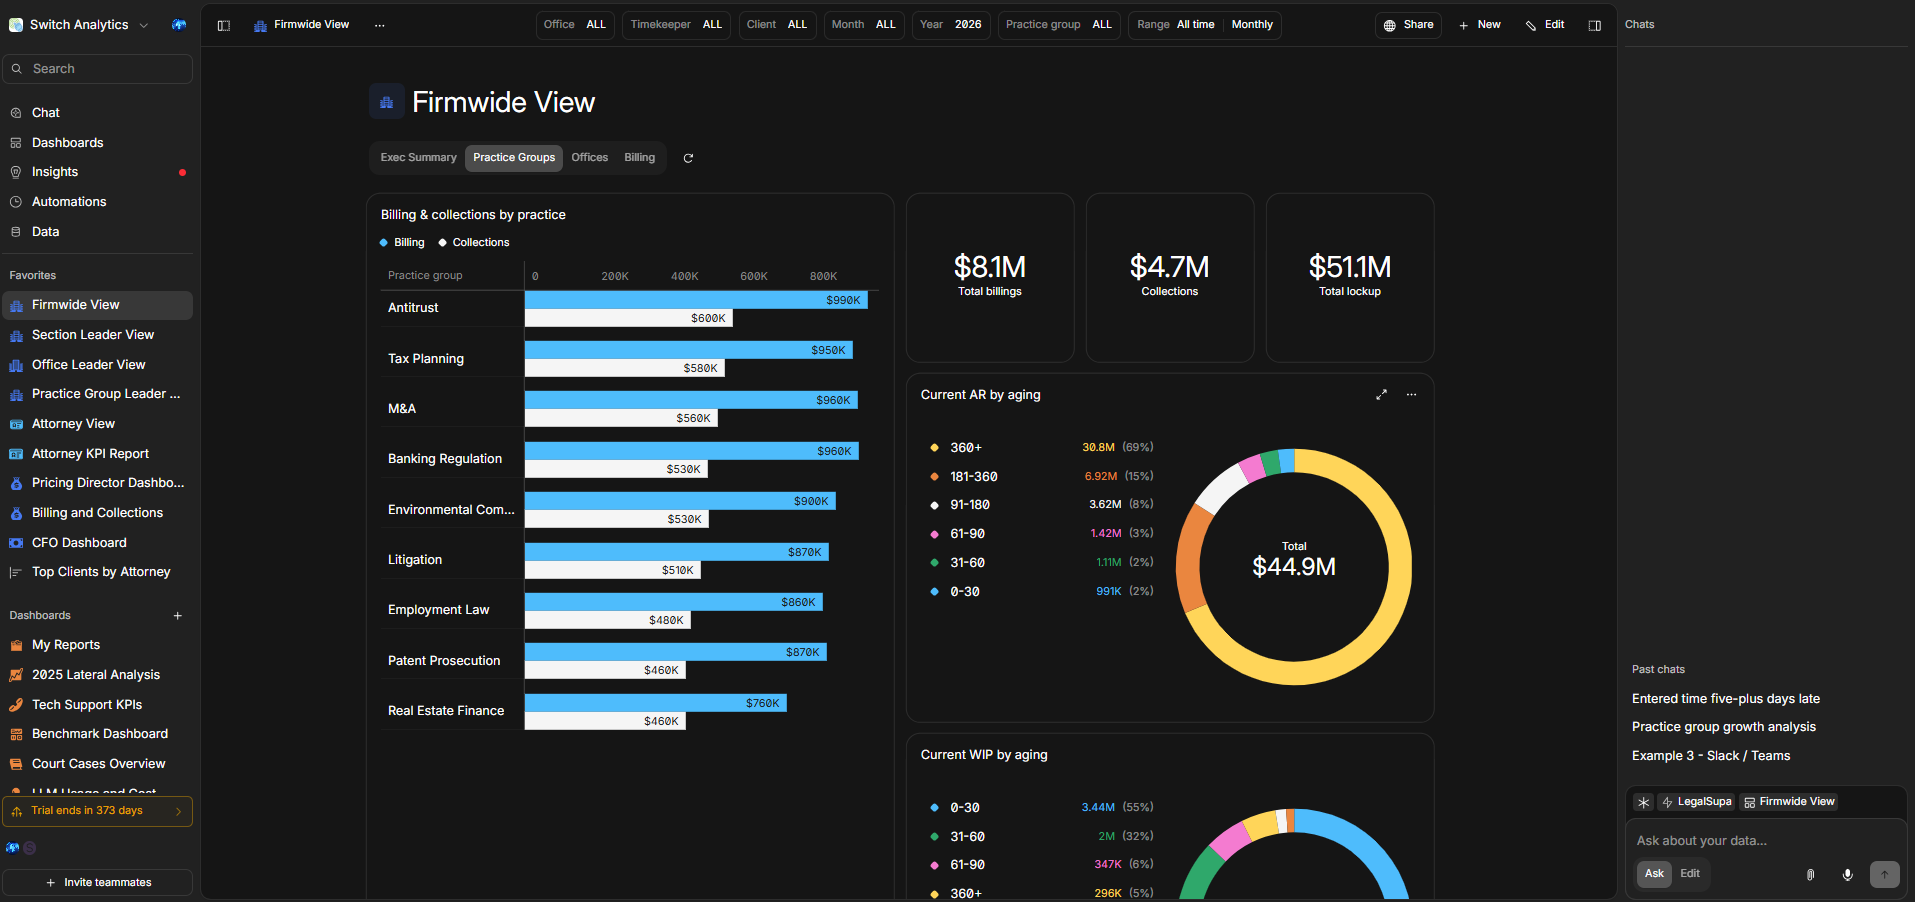
Management Committee Dashboard
A single view of firm health — revenue vs. budget, utilization by practice group, collections aging, and headcount trends. Updated in real time, no manual refresh needed.
Practice Group Scorecard
Each practice group leader gets a personalized dashboard showing their group's revenue, margins, leverage ratios, and associate utilization — compared against firm-wide benchmarks.
Billing Operations Dashboard
Track the full billing lifecycle from time entry to collection. See realization rates, WIP aging, write-off trends, and collections performance across the firm.
Example queries
How It Works
Get started in three simple steps.
Describe your dashboard
Tell Basedash what metrics, comparisons, or trends you want to see. Use plain English — no need to specify chart types or data mappings.
Basedash generates the layout
AI selects the right chart types, creates the queries, and builds a complete dashboard. Multiple visualizations are generated and arranged automatically.
Customize and share
Drag to rearrange, resize charts, or ask for changes in natural language. Share with your team, schedule automated delivery, or embed in your own applications.
Explore More Features
Discover the full Basedash platform.